Richest Cities in Tennessee (2026)
by Kristen Carney
Updated: February 9, 2026
Richest City in Tennessee
The richest city in Tennessee is Petros in Morgan County with an average household income of $325,743 as of 2024. While exceptionally affluent, Petros only has a population of 352 as of 2024. The richest city in Tennessee with at least 5,000 people is Brentwood in Williamson County with an average household income of $256,982 as of 2024 and 45,556 people as of 2024 according to the most current Census data available (citation).
| Rank | City | County | Population | Average Income | Median Income |
|---|---|---|---|---|---|
| 1 | Petros | Morgan | 352 | $325,743 | -$1 |
| 2 | Taft | Lincoln | 251 | $300,820 | -$1 |
| 3 | Lookout Mountain | Hamilton | 2,111 | $295,539 | $201,000 |
| 4 | Brentwood | Williamson | 45,556 | $256,982 | $182,088 |
| 5 | Ridgeside | Hamilton | 879 | $218,417 | $191,167 |
| 6 | Signal Mountain | Hamilton | 8,860 | $211,193 | $141,008 |
| 7 | Piperton | Fayette | 2,569 | $197,774 | $130,100 |
| 8 | Germantown | Shelby | 40,673 | $197,452 | $149,920 |
| 9 | Walden | Hamilton | 1,845 | $196,194 | $124,493 |
| 10 | Nolensville | Williamson | 15,074 | $192,123 | $177,148 |
| 11 | Dellrose | Lincoln | 86 | $189,654 | -$1 |
| 12 | Farragut | Knox | 24,634 | $182,084 | $142,093 |
| 13 | Fairmount | Hamilton | 2,110 | $178,078 | $137,317 |
| 14 | Apison | Hamilton | 4,271 | $177,837 | $129,307 |
| 15 | Collierville | Shelby | 51,515 | $177,754 | $138,598 |
| 16 | Louisville | Blount | 4,383 | $175,998 | $89,744 |
| 17 | Shackle Island | Sumner | 4,404 | $175,636 | $130,125 |
| 18 | Thompson's Station | Williamson | 8,294 | $172,719 | $132,647 |
| 19 | Flat Top Mountain | Hamilton | 1,004 | $162,465 | $121,131 |
| 20 | Franklin | Williamson | 87,133 | $155,399 | $119,528 |
Median Income versus Average Income: Which Should You Use?
We usually suggest using median income data – either instead of or in addition to – average income data as a true indicator of wealth. If you haven’t thought about median versus average since your last standardized test, you aren’t alone. Here’s what they are:
- average is the sum of a set of numbers divided by the count of numbers in the set
- median is the middle number in the set of numbers
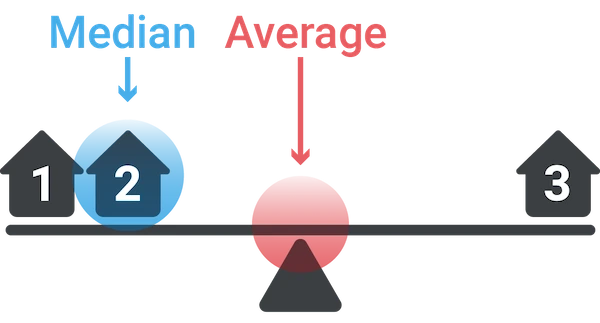
Now let’s say you had the following simplified set of income data.
Household 1: $30,000
Household 2: $50,000
Household 3: $1,000,000
The average income for this set is $360,000. The outlier data point ($1,000,000) skews the average WAY up. Conversely, the average income would be skewed WAY down if someone had an income of $500. The median income for the same data set is $50,000. Outlier data doesn’t skew the median.
Most Business Owners Should Use Median Income
So most business owners should use the median income as a true indicator of wealth, because it provides a more accurate representation of a typical income, especially in areas with significant income disparity.
When Should You Use Average Income
If your target market is high-income households, the average income may be more relevant. This is because the average income can highlight the presence of a higher concentration of wealthy individuals, which is beneficial for luxury goods and services marketing. We’re using average income on this page because using the Census’s highest reported median value of $250,001 could result in multiple ties for the richest geography.
Why do so many cities have a median value of $250,001?
The Census' American Community Survey uses $250,000+ as a jam value for median income estimates to protect privacy, ensure data consistency, and simplify reporting. A "jam value" in survey data refers to a placeholder or default value used when actual data points are unavailable, incomplete, or exceed certain thresholds. We represent this jam value as $250,001 to make it easy for you to sort.
You might also be interested in:
Email Me When New Data Are Released
Join thousands of subscribers and receive just 1 (ONE!) email a year in December when the US Census Bureau releases new income data for Tennessee richest cities.
SOURCES
United States Census Bureau. Annual Estimates of the Resident Population: April 1, 2020 to July 1, 2023. U.S. Census Bureau, Population Division. Web. May 2024. http://www.census.gov/.
United States Census Bureau. B01001 SEX BY AGE, 2024 American Community Survey 5-Year Estimates. U.S. Census Bureau, American Community Survey Office. Web. 29 January 2026. http://www.census.gov/.
United States Census Bureau. B19013 Median Household Income, 2024 American Community Survey 5-Year Estimates. U.S. Census Bureau, American Community Survey Office. Web. 29 January 2026. http://www.census.gov/.
United States Census Bureau. "DP03 SELECTED ECONOMIC CHARACTERISTICS." 2024 American Community Survey 5-Year Estimates. U.S. Census Bureau, American Community Survey Office. Web. 29 January 2026. http://www.census.gov/.
Products & Services
Plumbing
Connect
- 1-800-939-2130
- Contact Us
© Copyright 2026 Cubit Planning, Inc.