Richest Counties in Tennessee (2026)
by Kristen Carney
Updated: February 9, 2026
Richest County in Tennessee
The richest county in Tennessee is Williamson County with an average household income of $183,026 as of 2024 and 260,351 people as of 2024 according to the most current Census data available (citation).
| Rank | County | Population | Average Income | Median Income |
|---|---|---|---|---|
| 1 | Williamson County | 260,351 | $183,026 | $135,594 |
| 2 | Wilson County | 158,805 | $123,252 | $95,839 |
| 3 | Sumner County | 204,424 | $113,861 | $90,301 |
| 4 | Davidson County | 715,388 | $113,747 | $77,853 |
| 5 | Hamilton County | 376,192 | $108,057 | $76,183 |
| 6 | Cheatham County | 41,829 | $107,394 | $89,852 |
| 7 | Fayette County | 43,267 | $107,294 | $88,456 |
| 8 | Loudon County | 58,580 | $106,273 | $84,185 |
| 9 | Rutherford County | 360,646 | $105,834 | $85,470 |
| 10 | Knox County | 494,148 | $104,460 | $74,222 |
| 11 | Robertson County | 75,539 | $101,822 | $83,047 |
| 12 | Blount County | 139,333 | $101,394 | $77,365 |
| 13 | Dickson County | 55,983 | $97,770 | $75,003 |
| 14 | Shelby County | 919,173 | $96,640 | $63,767 |
| 15 | Marshall County | 36,049 | $95,058 | $71,049 |
| 16 | Roane County | 55,208 | $94,176 | $71,885 |
| 17 | Maury County | 107,791 | $94,120 | $76,130 |
| 18 | Montgomery County | 234,153 | $91,158 | $75,613 |
| 19 | Tipton County | 61,553 | $90,496 | $74,127 |
| 20 | Jefferson County | 56,864 | $90,264 | $66,114 |
Median Income versus Average Income: Which Should You Use?
We usually suggest using median income data – either instead of or in addition to – average income data as a true indicator of wealth. If you haven’t thought about median versus average since your last standardized test, you aren’t alone. Here’s what they are:
- average is the sum of a set of numbers divided by the count of numbers in the set
- median is the middle number in the set of numbers
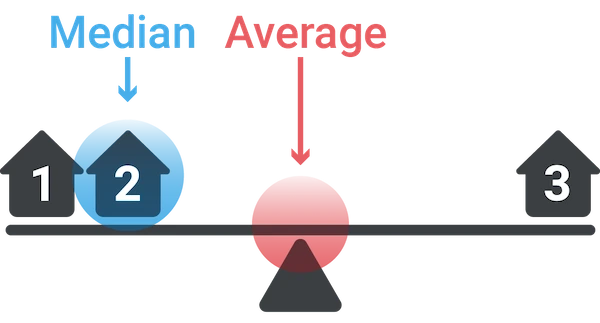
Now let’s say you had the following simplified set of income data.
Household 1: $30,000
Household 2: $50,000
Household 3: $1,000,000
The average income for this set is $360,000. The outlier data point ($1,000,000) skews the average WAY up. Conversely, the average income would be skewed WAY down if someone had an income of $500. The median income for the same data set is $50,000. Outlier data doesn’t skew the median.
Most Business Owners Should Use Median Income
So most business owners should use the median income as a true indicator of wealth, because it provides a more accurate representation of a typical income, especially in areas with significant income disparity.
When Should You Use Average Income
If your target market is high-income households, the average income may be more relevant. This is because the average income can highlight the presence of a higher concentration of wealthy individuals, which is beneficial for luxury goods and services marketing. We’re using average income on this page because using the Census’s highest reported median value of $250,001 could result in multiple ties for the richest geography.
Why do so many cities have a median value of $250,001?
The Census' American Community Survey uses $250,000+ as a jam value for median income estimates to protect privacy, ensure data consistency, and simplify reporting. A "jam value" in survey data refers to a placeholder or default value used when actual data points are unavailable, incomplete, or exceed certain thresholds. We represent this jam value as $250,001 to make it easy for you to sort.
You might also be interested in:
Email Me When New Data Are Released
Join thousands of subscribers and receive just 1 (ONE!) email a year in December when the US Census Bureau releases new income data for Tennessee richest counties.
SOURCES
United States Census Bureau. Annual Estimates of the Resident Population: April 1, 2020 to July 1, 2024. U.S. Census Bureau, Population Division. Web. May 2025. http://www.census.gov/.
United States Census Bureau. B01001 SEX BY AGE, 2024 American Community Survey 5-Year Estimates. U.S. Census Bureau, American Community Survey Office. Web. 29 January 2026. http://www.census.gov/.
United States Census Bureau. B19013 Median Household Income, 2024 American Community Survey 5-Year Estimates. U.S. Census Bureau, American Community Survey Office. Web. 29 January 2026. http://www.census.gov/.
United States Census Bureau. “DP03 SELECTED ECONOMIC CHARACTERISTICS.” 2024 American Community Survey 5-Year Estimates. U.S. Census Bureau, American Community Survey Office. Web. 29 January 2026. http://www.census.gov/.
Products & Services
Plumbing
Connect
- 1-800-939-2130
- Contact Us
© Copyright 2026 Cubit Planning, Inc.